
grafana/grafana
Over 74,000 stars on GitHub!
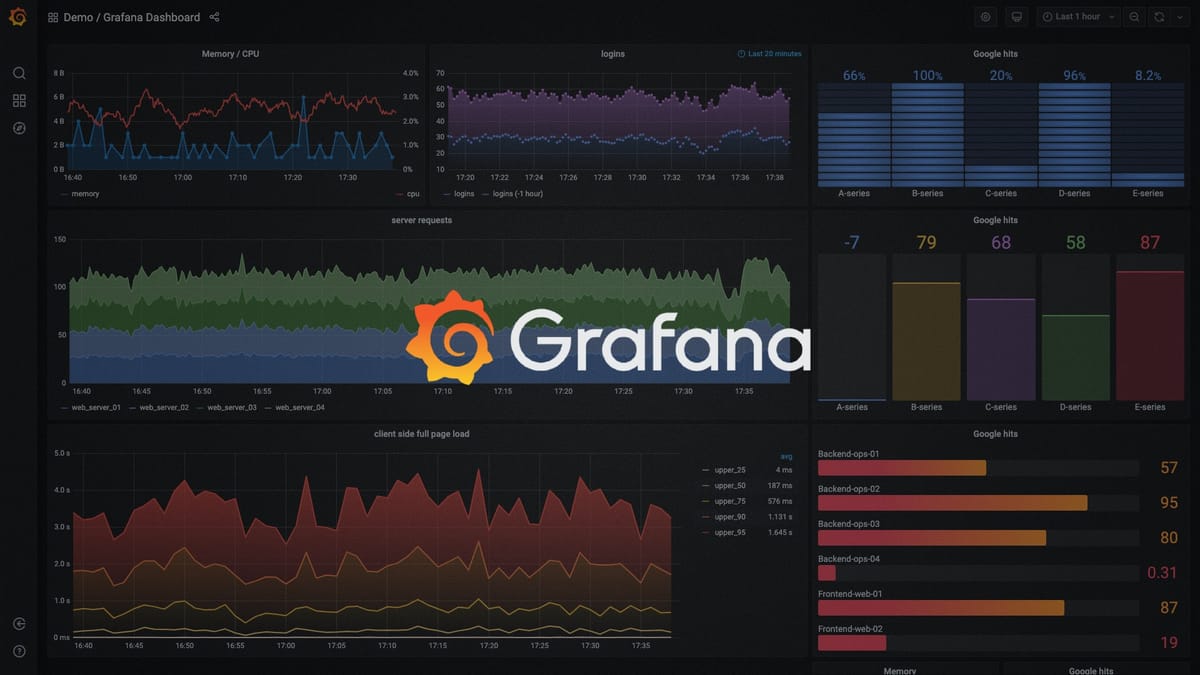
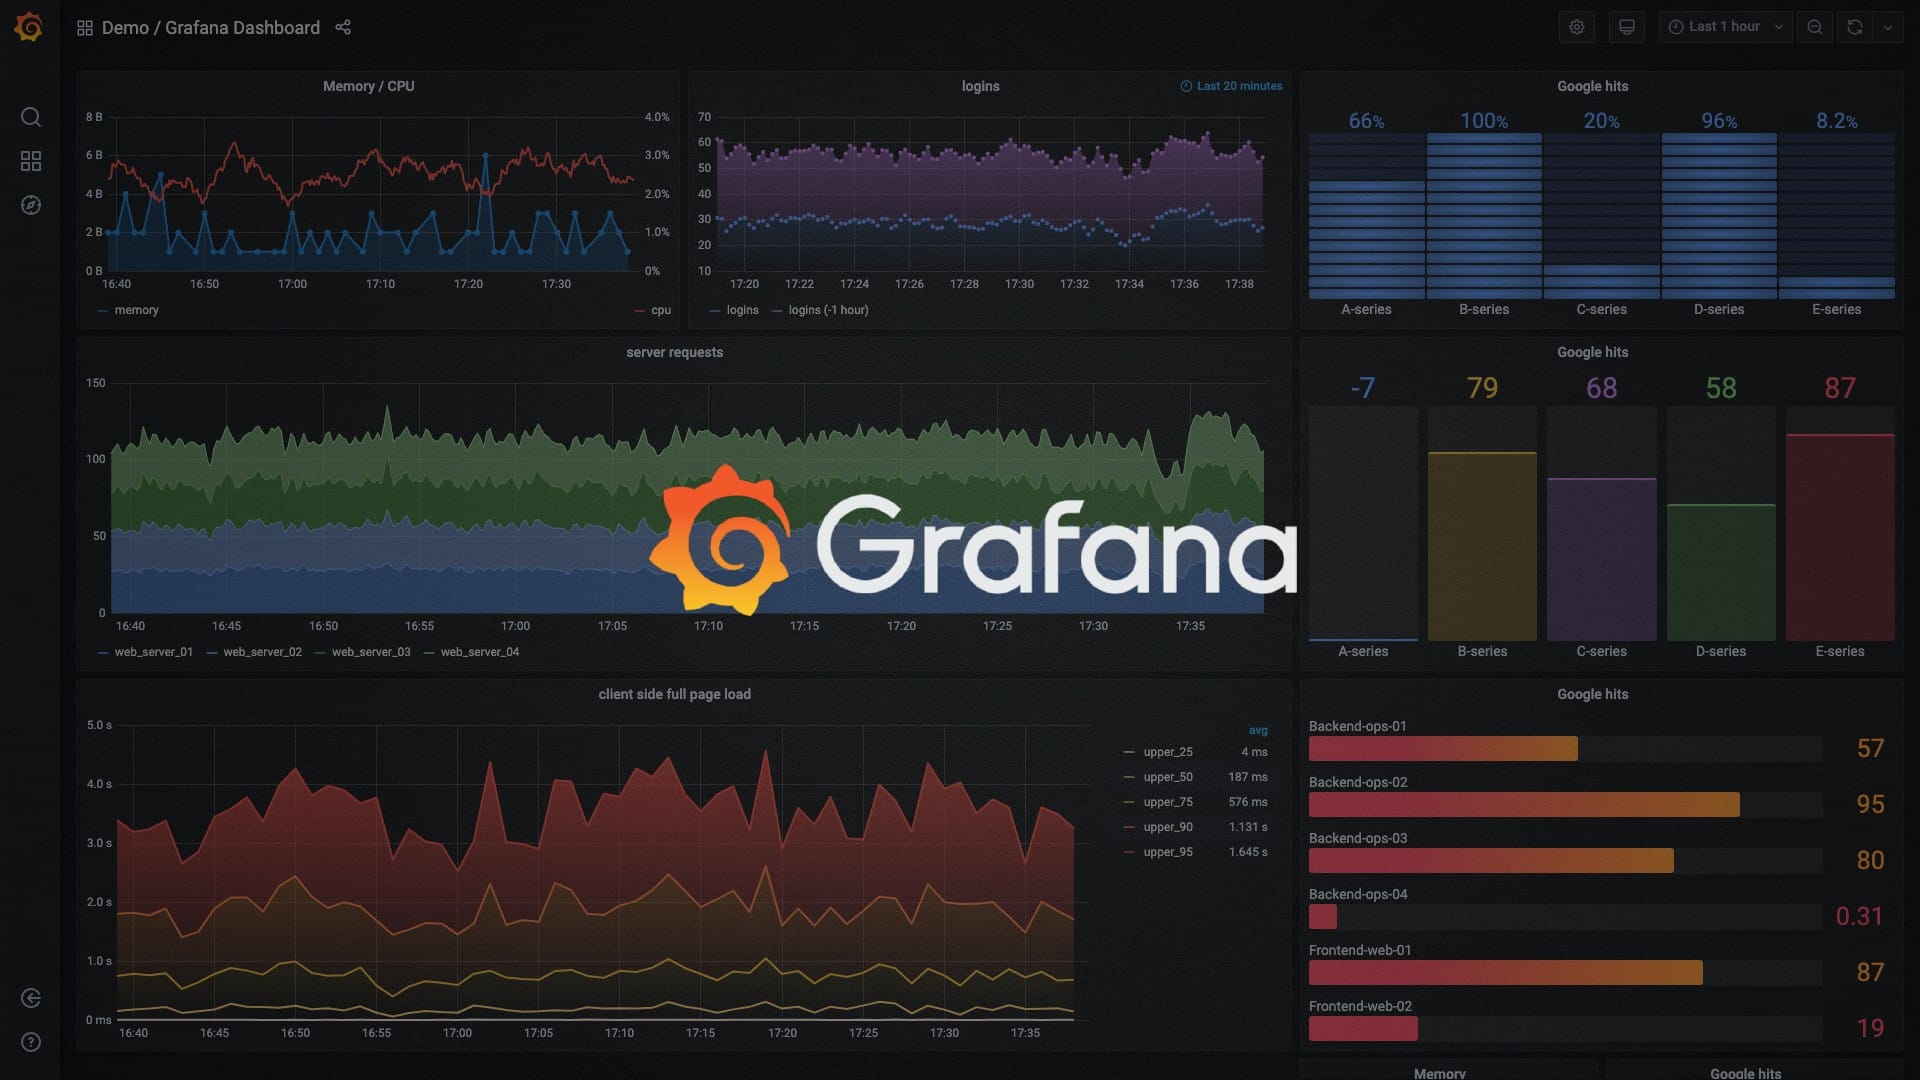
Grafana stands as the ultimate open-source platform for monitoring and observability, enabling modern software engineering teams to query, visualize, analyze, and deeply understand metrics, logs, and traces regardless of where they are stored in their infrastructure. The platform supports mixed data sources on a per-query basis, allowing users to combine distinct data streams like Prometheus, Loki, InfluxDB, and Postgres into a single unified graph to foster a collaborative data-driven engineering culture.
🔹 **Dynamic Dashboards**: Offers fast, flexible client-side visualizations with various options alongside template variables that appear as top-level dropdowns for highly reusable dashboard layouts.
🔹 **Logs and Alerting**: Enables seamless transitions between metrics and logs while preserving active label filters, paired with visual alerting rules that continuously evaluate metrics and push notifications directly to Slack, PagerDuty, or Webhooks.
🔹 **Community Engagement**: Distributed under the AGPL-3.0 license, complete with an interactive play sandbox on play.grafana.org, beginner-friendly issues for new contributors, a detailed developer guide, and active community Slack forums.
With its robust plugin architecture and flexible styling guides, Grafana empowers engineers to customize their observability stack, analyze performance bottlenecks, and gain deep insights into complex distributed system infrastructures.
https://github.com/grafana/grafana